Showing posts with label performance. Show all posts

08 October, 2015

Accelerated Mobile Pages

Browsing the web from our phones is nowadays a common thing.  In fact it is now likelier to browse from your phone than from a desktop computer.  Personally, I find myself using a desktop browser only while I'm at work or while doing some desktopy thing (such as coding or messing with VMs and networks).  If I'm just browsing during the evening, for instance, its 99% from my phone.

My preferred way of browsing is via the forum kind of applications, such as reddit or hacker news, so at that point I'm not really using a browser.  However, the majority of the content is delivered from websites so you see and interesting title, tap on it, and the in-app browser or the main browser is opened.  This typically works fine, until the site you're accessing is a megalith and takes tens of seconds to load.  After at most 3 seconds, if barely any content has loaded, the link is forgotten and I move on the the next link.  That's it.

The problem is that these websites are offering too many features for them to be practical on a smartphone.  Sometimes websites take even longer because they need to load the comments section, then come the suggested posts, with ultra big resolution images, followed by the author's biography...  It's unnecessary, I just want to see content.

A team of internet companies, including Google, have come up with Accelerated Mobile Pages (AMP).  It is primarily a technological development (not exactly unheard of, as we'll see), but  through its restrictions it tries to limit the amount of unnecessary crap on pages.  As I said, it's a development, however much of this development is in terms of standards and rules rather than faster networks, or something like that.

In fact ,the focus is on basically banning a whole bunch of heavy and also some outdated HTML elements.  Unsurprisingly, no more <applet>, no more <frame> and no more <embed>.  There are also strict limitations on JavaScript, however the most surprising (but great) banned elements are <input> and <form> (with the exception of <button>).  It may not directly impact immediate performance of HTML, but it will surely stop developers from adding useless "post a comment" forms.

The focus is primarily on immediate content.  If I get a link while chatting and I open it up, I don't have more than 3 seconds to read the title and move back to the chat.  Thankfully, on Android, this experience shall now improve with the new chrome tabs introduced in Marshmallow.  It's a technical thing, but basically it avoids having to use either an in-app browser (which is isolated from your standard chrome) or opening up chrome (which is slow).
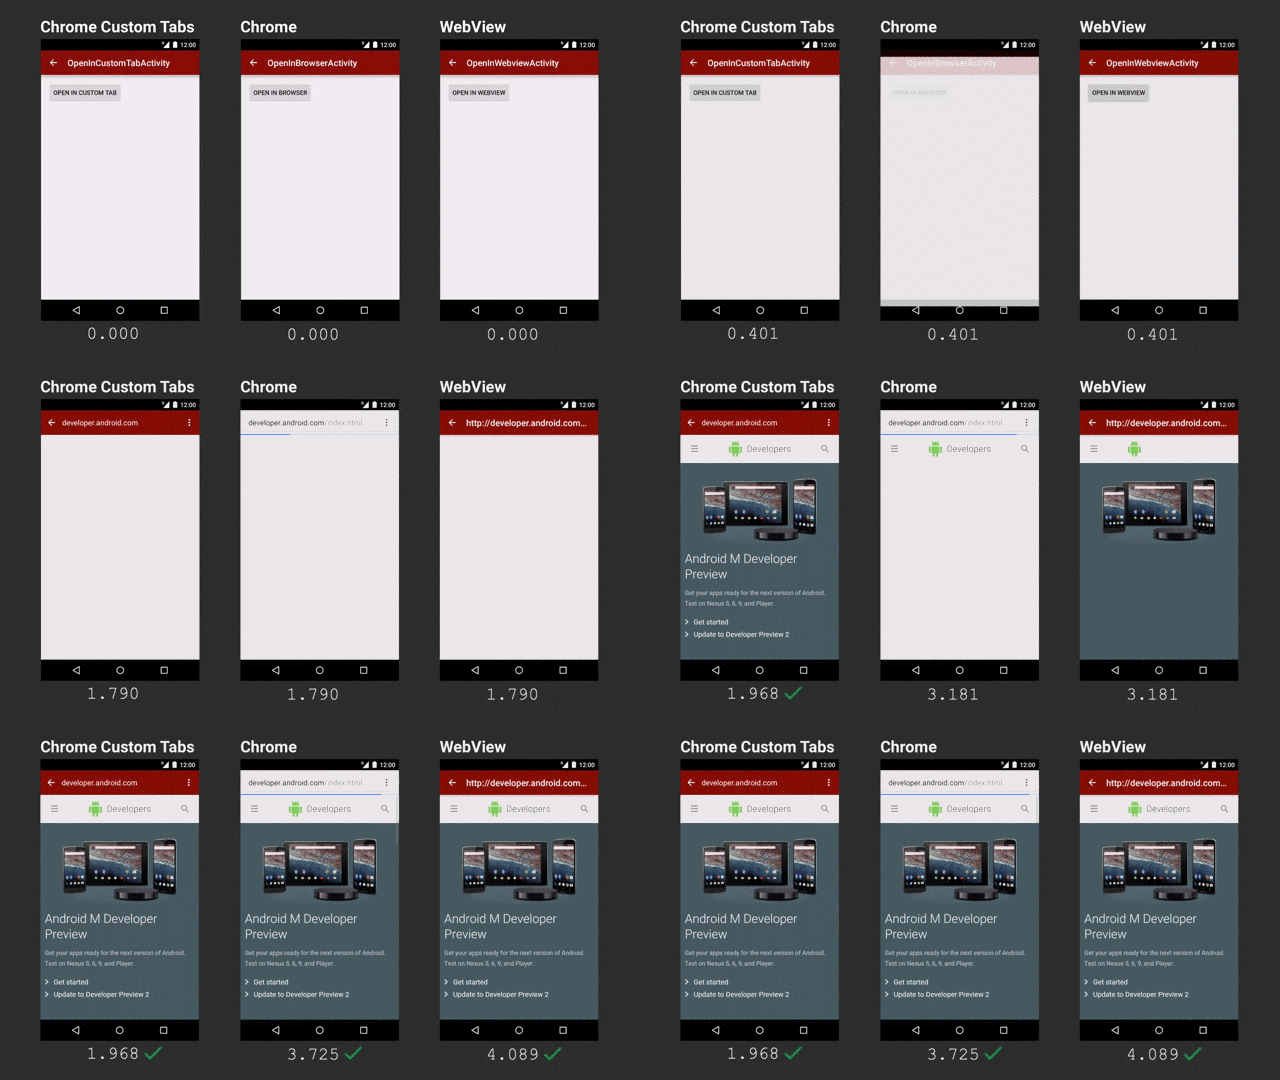
Chrome tabs are much faster, at least in this demo (via Ars Technica)

But let's get back to AMP.  As I said, it is content that the majority wants, so in this age of platform webapps, single-page sites and all the rest, simplicity, again, trumps features.  Despite the lack of features, static areas of a website are hugely important.  If you're interested, here's a short how-to, however it is fair to note that static this time is mostly client side, so no JavaScript - which means you'll probably need server-side processing if you have "dynamic" content.

AMP avoids the common JavaScript the web is used to and realises the idea of Web Components.  These do have JavaScript under the hood, but since they are managed differently, it makes the page load faster without synchronous blocks by JavaScript.  AMP also restricts inline styling, conditional comments and some CSS attributes (although CSS is not so limited compared to JS).

As yet, (being days or hours since being announced) I personally do not consider this as a major breakthrough technologically - it's only a set of rules to reduce the bloat on webpages who primarily host content.  However, I am very glad with the way things are going and I do hope it gains traction.  

The benefits I see are greatly improved user experience with much faster load times and no nonsense web pages along with better development.  The more modular the pages, due to web components, the easier it is to develop.  There are no messy inline styles or randomly placed JavaScript.  Things are put in their place and the rules are strict - otherwise you'll not qualify for AMP and your page won't make it to the top of search results.  

Unfortunately, I don't have that much control on this blog, otherwise I would have AMP'd it right away!

For further details, there are quite some resources:

04 October, 2015

Linux, Virtualisation and some Performance monitoring

P.S.  This post is more of a noob's voyage towards better virtualisation on Linux than some professional guidance.
 
A few days ago I was facing an issue on my Linux machine where performance suddenly dropped to near unusability while the hard disk LED was on overdrive.  My first thought was that there may be some excessive swapping going on.  The problem was, though, how to identify what was causing this rather than what was happening.

Cheesy image for computers!


I could have guessed what the reason was since I had just turned on maybe the 10th VM on VMWare workstation.  Despite this fact it was not immediately obvious which VM might be swapping rapidly or why it was doing so (there shouldn't be much memory usage during startup).

As yet, I haven't totally found out what it was but messing with some config files did the trick up to a certain point.  First of all I limited VMWare to 16GB or RAM (out of 32) and configured it to swap as much as possible.  I was led to believe that VMWare's and the kernel's swapping mechanisms weren't on the same terms, which ended up with me bashing (excuse the pun) the whole system.  A few miraculous key presses took (Ctrl Alt F1) me to the terminal from where I could, at least, get a list of CPU heavy processes and kill them.  Unfortunately it was not just vmware-vmx processes but also kswapd0 - an integral part of the system which won't easily allow you to kill -9 it.  So basically this was the first indication of a memory issue.

After some googling I reconfigured swapping etc.  but I wasn't able to replicate the issue and quite frankly I really did not want to spend 15 everytime to recover my system.  So the process of finding a solution took days - not continuously trying to fix it of course.  the best solution I could come up with was buying a small 50GB SSD and using it all for swapping.  Apart from that I also set the vm.swappiness to a nice 100.  The memory configuration on VMWare was set to swap as much as possible too.  My idea was to allow everything to swap as much as they can since the disk was much faster now.  Apart from that, I'd have as little occupied memory as possible.

I thought I'd start seeing a lot of fast swapping this time, so in case I got into the same situation again, it would be much easier to recover.  In fact it did happen once again, but this time the system was under much more stress, so the extra swapping did help.  This time I had a little script prepared so the 10 second long keypresses would not waste much of my time when typing in all the arguments.  I used the following script to see what was hogging the CPU, network, disks - almost every possible bottleneck I could think of:

#!/bin/bash
dstat -cdnpmgs --top-bio --top-cpu --top-mem

Short and sweet, just calling dstat with canned arguments!  Calling jtop is a lot shorter than all those arguments, that's for sure.  Again, the result was swapping a swapping issue. 

dstat however showed me something I was not really expecting.  RAM usage wasn't really that bad, actually, just by looking at numbers it was great - less than 50% usage.  However there were some more numbers and at that point I was not sure if I was actually using ~40% or 97%.

Reading up on Linux memory management taught me another thing.  Linux is actually making use of much more RAM, however the bulk of it is caching.  This cache is cleared when more memory usage is required by processes.  Effectively I would see that there is less than 2-3% free RAM but that is not the correct way to read it.  So there is some silver lining to this issue - I got to learn quite a lot more on memory management on Linux.

Following this result I started looking for a virtualisation solution that did not try to re-implement what the kernel was built to do.  Not that I have anything in particular against VMWare or how it is implemented, but I was quite sure that the problem was originating from it.  After a bit more educated reading on virtualisation, and a bit more courage to move out my (then) GUI-based comfort zone (few weeks before the said case I was mostly a Windows user..), I came to the conclusion that the Linux-based systems were potentially much better.


The logo is cool though
Here I introduced myself to KVM and Xen.  Both appear to be more ingrained into the system and had potentially better memory management.  I read up on some general performance and history of both systems and KVM appeared to have the upper hand.  Being a more integral part of the Linux eco-system (and marginally faster https://major.io/2014/06/22/performance-benchmarks-kvm-vs-xen/) I opted to base my future VMs on KVM.  I'm happy to say that I've never looked back since then and the impressive performance I enjoy on KVM is (on my system) unparalleled.

I'll let the kernel manage my memory
There is no particular conclusion here, except that maybe you should be familiar with your options before making decisions.  I've got nothing against VMWare, as I said, I simply found something that works better for me.  Management tools are far better on the VMWare side, but I'm satisfied with what VM Manager offers in terms of management and monitoring.  Oh, you may also make use of the "script" I have.  It's convenient when you need to see some performance details while not keying in some 5 arguments.  I might write something on KVM next time, since it allows one to define many more options rather than a few clicks and done.


02 October, 2015

Hosting static websites on AWS S3

Hosting websites nowadays has become quite simple, easy and affordable.  Years ago you would try to find free hosts which would allow you to upload a few files and you're done.  GeoCities and freewebs were some of the most popular of these services.  As time went by, the data centre landscape has changed dramatically and the current situation is big companies offering extremely cheap hosting services.  The market is so huge that the classic "brochure site" has become almost free to host while still enjoying world class availability and scalability.

Static websites are the simplest form of site.  These are just a set of HTML pages linked together via links.  No complicated code, no weird configurations - just plain old files.  Depending on what you want, such a site may be ideal (maybe you do all your business transactions over a facebook page and use the site just as a brochure).


This of course has the advantage of being simple, easy, cheap and can be up and running very quickly, including development time.  It lacks, however, some of the major features you may want, such as a member's area, blogs and news, user-generated content etc.  But then again, you might not want these extra features.  In that case, here is a simple, short and sweet guide on how to host your site on Amazon Web Services.  There is no doubt that it is currently the leader in cloud services and it would be wise to use their services.

1. Get A Domain

The first thing you need is the dot-com.  You may use or favourite registrar or just randomly choose one from these that come to mind: noip.com, namecheap.com, godaddy.com.  If this is your first time you may want to read up on registration etc. but all you need is to find a domain that is available, buy it, and configure it as explained later.  Make sure you do not buy hosting with it, as some providers will try to bundle them together.  Well you can do whatever you want, but it's not necessary in this case.

2. Sign Up with AWS

Log on to aws.amazon.com and sign up for an account.  Choose your region, etc and keep going until you get to the main control panel.

3. Hold your horses!

The control panel may be overly complicated.  It isn't, though.  The number of services may be overwhelming, including the names, but we'll get through.  Only two services are required in our case.

Cloud providers typically offer more than just simple hosting.  Keep in mind that big enterprises are running their businesses here too, so this complexity is to be expected.  One of the core offerings of a cloud provider is storage.  Storage keeps everything in place - services need to save their logs, applications exist in storage, databases are persisted to storage...you get the pattern.  Again, due to the enterprisiness of this offering, the storage services have their own terminology.

Your usual "hard-disk" or "USB drive" (or floppy disk) is known as a bucket.  You have a bucket in the cloud in which you put your files.  Amazon offers storage in a service known as S3 - Simple Storage Service.  These bucket also tend to be dirt cheap.  A site a less than 10 pages and low to moderate traffic may cost you no more than €1 a month.

4. Creating the site

Now that you know about the basic concept, it is time to create the storage for your site.  In this example (and pretty much any other tutorial out there), we shall use the example.com domain.  Whenever you see this written down, replace it with the domain name you bought.  Do not prepend it with "www."; that is a subdomain, not the proper domain that you bought.

4.a. Sign in to https://console.aws.amazon.com/s3/;
4.b. Create a bucket named example.com;
4.c. Create another bucket www.example.com (with the www);
4.d. Upload your content to the first (example.com) bucket;

What we'll do is host the site on the example.com bucket and redirect any traffic coming in to www.example.com to it.

5. Prepare the site

Now you'll need to allow the public to access your buckets, otherwise they'll be forbidden from seeing your content (which, presumably, you want to be publicly accessible).  All you need is to attach the following bucket policy to your example.com bucket.  Again, make sure you replace example.com with your domain.

5.a. Set the policy
{
  "Version":"2012-10-17",
  "Statement":[{
"Sid":"AddPerm",
        "Effect":"Allow",
 "Principal": "*",
      "Action":["s3:GetObject"],
      "Resource":["arn:aws:s3:::example.com/*"
      ]
    }
  ]
}

5.b. Set up as static website by clicking on the bucket and select the Static Website Hosting section.  Choose the 'Enable' option;
5.c. Name the index page.  This is the "homepage" of your site.  Typically this is named "index.html" or similar;
5.d. Test the page by entering the Endpoint URL shown to you in your browser, just to make sure it is accessible;
5.e. Select the second bucket (www.example.com) and in the same section choose to redirect requests.  In the input field, enter your domain (without www.);

6. Wire it up

Another service that is required to properly route traffic to our site is Route 53.  As you've seen, you endpoint is appended with a much longer address belonging to amazon.  You wouldn't want to distribute that URL to your clients, after all you bought your own domain.

Route 53 is basically a DNS service - an internet directory for converting example.com to a number that the internet understands.  You do not need to do any of this works, except how to inform the registrar about your shining new website on AWS.  Here's how:

6.a. Open up https://console.aws.amazon.com/route53 and create a hosted zone for your domain (no www.) - Click Get Started Now under DNS Management, or just go to Hosted Zones and then Create Hosted Zone;
6.b. In the details section you'll see a Delegation Set - a list of addresses.  Write these down somewhere, we'll use them later on;
6.c. Click Create Record Set and enter you domain name.  Mark it as Alias and from the Alias target select your bucket.  Do this also for the www.example.com (point it to its own bucket).

7. Finishing

Now that everything is set up on AWS, all you need to do is inform the domain registrar (the site from where you bought your domain).  Remember the 4 addresses in the Delegation Set?  These will now be used to configure the DNS addresses for your domain.  What you need to do is log in to your domain registrar control panel and configure your domain.  Somewhere you should be able to change the DNS settings for it.  Not all providers have four fields - there may be more, there may be less.  Enter all four addresses in the delegation set in the domain configuration.  If there are less than four fields, that's it.  If there are more than four, leave the rest empty.

8.  Live!

Now that you're done, you may need to wait a few minutes until the DNS settings are updated.  This is not related to your site on AWS but on the nature of DNS - i.e. people's ability to enter example.com and be properly taken to your site.  These may take up to 48 hours, but in my case it was only a matter of minutes.

Hope you found this helpful!

01 October, 2015

HDMI over WiFi

No not really, no such thing exists.  Well you can stream HD media over WiFi but not in a plug and play way as a common HDMI cable.  There are various ways this can be accomplished but the idea is simple;  run a server from a device and play it on another, as long as there is a protocol, typically DLNA.


Recently I came across a new video format which looks quite interesting and powerful.  HEVC was released a few months ago (only drawn up sometime in 2013) and is now gaining traction.  I was surprised to find that an hour long HD video can be compressed down to 200 megabytes or so.  Being so new not many players can really decode it, as expected.  If you're on Linux, great news! It's not so hard to get it to play.  As always, VLC is your best friend so the solution I have/found is for VLC.  All that's needed is a new library from a PPA and you're good to go.

sudo apt-add-repository ppa:strukturag/libde265
sudo apt-get update
sudo apt-get install vlc-plugin-libde265

That takes no more than a few seconds; minutes if you're on a slow connection (which makes the HEVC format ideal in your case).

I wrote this little post about this format because I am quite interested in how the far we can compress HD videos, but also because it was a bit inconvenient for me to not be able to play it pretty much anywhere (BubbleUPnP and chromecast appear to handle it though).  It may spare you some time hunting for a way to watch that latest episode next time :)  Yet still, my original thought (and title) of this post were actually meant for something totally different, but hey, two birds one stone!

I need to learn to HDMI
Having organised cables is quite important if you intend to keep your sanity.  Not long ago I did rewire my homelab and after a few hours everything look perfectly in place.  Except for one thing; WiFi.  It was constantly disconnecting and apparently going offline and back again for no apparent reason.  Restarting, re-configuring and switching ports fixed nothing.

A few hours or days go by and I started noting red pixels showing up on my screen at particular points where the image was darker.  Then it hit me.  There must have been some interference between my WiFi router and the HDMI cable in its vicinity (hence the title ;)).  Looking around on the internet seemed to prove my theory, even though similar cases appeared to be quite uncommon.  I have not completely fixed it yet however messing around with the cable is a good workaround.  That's until the shielded HDMI cable arrives in my mailbox, which should hopefully fix the issue.


14 December, 2011

Caching : The unsung hero of performance

It's not just abstract numbers after all :)
Many people tend to forget, or worse, ignore the fact that caching plays a vital role in many applications.  Why would they place a cache in the CPU for example?

This idea might come from the fact that in an age dominated by the web and fast internet access, some might think that cached pages are unnecessary.  True, at times you end up with a lot of space taken up by pages you visited only once.

But caching is more than just a copy of a page on your hard drive (or SD Card).  In this post I shall demonstrate how a terribly simple implementation of a cache in a Fibonacci algorithm will have a massive impact on performance.  Obviously one might not find many uses for Fibonacci numbers, but the idea can be used in many areas, such as crawlers, searching and environments where some value which is unknown but is somewhat constant is required frequently.

Many know what Fibonacci numbers are, so I won't be going into a lot of details about their algorithm, but don't worry though, it's very easy to implement it Java.  This time we'll be writing a single class, having only 3 methods.


import java.math.BigInteger;
import java.util.HashMap;


public class Fibonacci 
{
private static HashMap<Integer, BigInteger> cache = new HashMap<Integer, BigInteger>();

public static void main(String[] args) 
{
int v = 35;
if(args.length>0)
v = Integer.valueOf(args[0]).intValue();

System.out.println("Fibonacci efficiency tester for Fib("+v+").\n\n");

long n = System.currentTimeMillis();
System.out.println("Cached: "+fib(v, true));
long mst = (System.currentTimeMillis() - n);
System.out.println(getTimeFromMs(mst/1000));

n = System.currentTimeMillis();
System.out.println("Non-Cached: "+fib(v, false));
mst = (System.currentTimeMillis() - n);
System.out.println(getTimeFromMs(mst/1000));
}

Not much here.  Just declaring some variables and a main class.  The main class starts off by declaring the number of iterations we plan on doing.  In this case variable v takes care of that.  Don't set it too high, otherwise you might end up waiting 5 minutes until you get a result!  Next we check if we have any arguments;  if so, we assume that it is the number of iterations to perform, so we set v as that value.

Then we just start displaying the result messages.  As you can see we are measuring the time it takes for cached and non cached calculations.  I know I have created a benchmarking tool, but it's OK to use the normal system time here.

Now it's time to code the real Fibonacci method.


private static BigInteger fib(int f, boolean cached)
{
if(f<2) return new BigInteger(""+f);


if(cached)
{
if(!cache.containsKey(new Integer(f)))
{
BigInteger v  = (fib(f-2, cached)).add(fib(f-1, cached));


cache.put(new Integer(f), v);
}
else
{
return cache.get(new Integer(f));
}
}

BigInteger n1 = fib(f - 2, cached);
BigInteger n2 = fib(f - 1, cached);
return n1.add(n2);
}


What we are doing here is recursively calling the same method.  It is much cleaner than a loop, and anyway, a loop does not always suffice, such as in cases of crawling.  Before performing anything complicated, we check if the number is high enough to be calculated.  So if we have a 1 or 0, there's nothing much to do, so just return it.  Otherwise, we will perform the normal calculation.

We check if the caching is enabled, as this is all about caching after all, an then the calculation is performed.  So if we have caching enabled, we will first check if the cache contains the Fibonacci of the number we are currently analysing, and if it does, we are done, and return it.  Otherwise we will calculate it and cache it.  If caching is not enabled, the value is calculated every time.

We then write the usual method which cleanly shows the value in a more humane way :)


public static String getTimeFromMs(long ms)
{
if (ms < 1000)
return ms + "ms";
else if (ms >= 1000 && ms < 60000)
return (ms/1000) + "s " + getTimeFromMs(ms - ((ms/1000)*1000));
else if (ms >=60000 && ms < 3600000)
return (ms/60000) + "m " + getTimeFromMs(ms - ((ms/60000)*60000));
else return (ms/3600000) + "h " + getTimeFromMs(ms - ((ms/3600000)*3600000));
}


That is all basically.  You can now run this program and see for yourself the improvement which is gained through caching.  I have provided my results below;  naturally yours will have some variations, but there definitely will be a huge difference between the cached and non-cached runs.


Fibonacci efficiency tester for Fib(35).


Cached: 9227465
in 2ms
Non-Cached: 9227465
in 3s


Make no mistake. There is an 'm' in the cached, while there is not in the non-cached. That means we had a whole 3 second difference. Now, hopefully, you shall be writing more sensible code and freeing the CPU from eccessive and unnecessary work :)

The full code is available here.

186Gbps : Breakneck network speed

I have just read an article about a new network speed record and honestly I could not believe at first.  This really means that I can transfer my whole hard disk content, over the network, in less than 10 seconds!

So many recent tech and science news recently hehe; hybrid drives are getting popular thanks to extremely faster seek times, this network record, quad-core CPU's in phones...Honestly, I simply can't seem to think that there is a limit.  Just as you lay your hands on something which feels like the bleeding edge of technology, you end up reading an article the following day totally eclipsing your new device.

Let's hope that we'll be seeing at least 1% of this technology's power get to our homes.  1% if you think of it, is enough, for now.  That's almost 500Mbps, definitely much more than your 20 or 50Mbps. [Press Release]

07 December, 2011

Curious JCIFS Behaviour

For those of you that do not what JCIFS is, it is a Java library which helps you deal with SMB Files in a way very similar to handling normal local File objects.  You can list files, open input streams, delete, rename and some other operations.

Recently I was working with this library, specifically building small search tool, which crawls the directories you specify and then return the results.  Apparently I was having problems with something that many people tend to overlook, or forget about.  Handles originating from my java program never seemed to close.

As you can see, many applications have a few hundreds, including the JVM I have running (see screenshot).  So the other day I was testing memory and CPU usage, and they were pretty much under control, until I had a look at the handles column.  I began testing small directories, containing less than 30 or so items in total.  The handle count rose but it was negligible,  since it was at maybe 50 and maybe rose to seventy something.  I did not notice since a number of handles might be opened by the JVM and not my code so I ignored it.

After the initial tests, I thought some heavier directory should be crawled, so I pointed it to the desktop, which contains thousands of files (within sub directories obviously,  not even a 100" TV could have a 1000 icons on the desktop :P).  So again, I fired up the program and bam!  I had over 15000 handles, which is absolutely unacceptable.

Practically I have found no solution to this, yet.  I really would like to know if any one has had this problem, because as far as I know, there are no methods that close the connection.  You can only close streams, and that's OK, but what should I close if I am calling list() or listFiles()?

06 December, 2011

Basic bench-marking in Java

No, not that basic, don't worry
Benchmarking is useful when dealing with applications where performance is vital.  There are a million ways to bench mark your methods; profilers, tools, libraries, etc.  But honestly, sometimes it's too much of a hassle if all you want is a rough estimate of how much time a method or loop or anything else is taking.

So what I did was just a simple class which simply logs the start time, and end time, and prints it out if necessary; nothing outlandish.

The idea is to call a static method start just before entering the code to be tested, and then calling stop or stopAndPrint() when you want to, well, stop profiling.  The Timer class basically holds an array of "start times" and each time start is called, the pointer moves up, and down when stop is called.

PS: The complete code for this post is available in the downloads section, under Code, name Timer.java.  As this is the first time, I think you should know that the files are hosted Google docs, so just go there and hit download at the top right of the screen :)

Let's start then:

package com.jf.utils;


public class Timer
{
    private static final int MAX_TIMERS = 50;
    private static long[] startTimes = new long[MAX_TIMERS];
    private static long stopTime;
    private static long time;
    private static int pointer = -1;

So here we got :
  • MAX_TIMERS which is a constant defining the maximum number of nested timers.  This limits the number of  consecutive starts we can have without stops;
  • startTime is an array of long which shall keep track of all the starting times;
  • stopTime is the time of the latest stop;
  • time is the time between the last start and stop;
  • pointer points to the current timer in the array, or the current consecutive timer.
public static void start()
{
    pointer ++;
    if (pointer > MAX_TIMERS)
    {
        System.err.println("The maximum timer count limit has been reached." +
        " Close some timers first before attemptin to open a new one.");
        return;
    }
    startTimes[pointer] = System.currentTimeMillis();
}

So this will start "profiling".  First, it will move the pointer up, so that it will put us in the next free location.  Next it will check if we reached the limit.  If we are at the limit, we will get a simple message, since we do not want a heavy class and will not be throwing any exceptions.  Finally it will record the starting time.  As you can see this is not at all an accurate way to test performance.  There are some milliseconds "wasted" just to increase the pointer and check if we are at the limit.

public static void stop()
{
    stopTime = System.currentTimeMillis();
    time = stopTime - startTimes[pointer];
    pointer--;
}

stop will, quite obviously, stop the timer.  What is does is rather simple.  We immediately record the current time, so as to avoid wasting time doing other tasks.  That is why we have a variable storing only the latest stop.  Then it will calculate the total time since the last start, pointed to by the current value of pointer.  The last operation is to move the pointer to the previous timer.  So as you can see we can only nest timers and every call to stop will simply stop the last timer that we started.

public static void stopAndPrint()
{
    stop();
    System.out.print("Timer in ");
    System.out.print(Thread.currentThread().getStackTrace()[2]);
    System.out.println(" clocked approx. " + getTimeFromMs(time));
}

A rather simple and convenient method is this one.  Here we will stop the timer and print out the values.  Note that calling this method might produce less accurate results, as time is wasted again while calling the method stop.  We can sacrifice code cleanliness here by placing the same code in stop here, so that a true stop operation is performed here without having to call another method.

public static String getTimeFromMs(long ms)
{
    if (ms < 1000)
        return ms + "ms";
    else if (ms >= 1000 && ms < 60000)
        return (ms/1000) + "s " + getTimeFromMs(ms - ((ms/1000)*1000));
    else if (ms >=60000 && ms < 3600000)
        return (ms/60000) + "m " + getTimeFromMs(ms - ((ms/60000)*60000));
    else
        return (ms/3600000) + "h " + getTimeFromMs(ms - ((ms/3600000)*3600000));
}

This is purely a convenience method which will cleanly print out a time passed to it in milliseconds and print it out in milliseconds, seconds, minutes and hours.  It recurses over it self until it gets to hours and cleanly groups minutes, seconds and millisecods.

So there you go.  A simple and ultra-basic way to test your code performance.  The thing is that this does not require any libraries (not even imports), or special IDEs or tools.  Just place this somewhere in your project and call start() and stop() or stopAndPrint() when ever you need to quickly get a rough idea.

The following code will give you an idea:
public static void main(String[] args)
{
    //Start profiling the whole main class
    Timer.start();
    int x = 10;
    int y = 5;
    //Start profiling the mul(x,y) method
    Timer.start();
    mul(x, y);
    //Stop profiling the mul(x,y) method and print result
    Timer.stopAndPrint();

    //Stop profiling the whole main class and print this one too
    Timer.stopAndPrint();
}

public static void mul(int x, int y)
{
    System.out.println(x * y);
}

Happy coding :D !

Crashing the JVM

The Java Virtual Machine is quite impressive, considering it is so stable that large corporations and even banks depend on it to perform a myriad of tasks.  Even Google uses it.  So there you go, a great tool which is stable, clean, fast and loved by many.

As you might also know, it works by having byte code being sort of interpreted and executed, in real time.  Now the problems lies not in this relatively intense part of the system, but at a higher level - the language itself.  You see, Java makes it easy to create, use and handle objects, but how the hell can you create an object without ever reserving memory for it, just like in C++, for instance.  Java does this automatically, and it also destroys and gives back memory (to the OS) automatically.

Don't put this kind of code if your building some
arsenal management console.  Really, don't.

That task belongs to the garbage collector, a separate thread running in the background, and then at some point, stops everything (really, it's called "Stopping the world") and removes any unused objects laying around. Basically what can happen is that if the memory is not being cleaned, you end up putting every single new byte in memory, on the heap.  The memory is obviously limited, so eventually it will crash.  This can be caught by "OutOfMemoryError", as you would usually catch normal exceptions.  It is not always possible though, since when the JVM crashes, the problem is "outside" of the program execution, specifically in the memory manager. Segmentation fault, as it is known, happens when the memory can't be managed.

The following code causes this error, and the reason is that we are creating an array of the same array, which eventually adds up to one huge array of array of array of etc.  This basically crashes the whole JVM and will give you a JVM error, which unlike traditional errors, can't be handled.

So essentially, the moral of the story is that even though it is clean and simpler to leave GC out, please, always ensure that you still keep object creation under control, as you do not really know what happens during execution.  It is also important to keep that in mind when coding mobile apps, those devices have much less memory, and processing power for that matter.  Please also note that this code is common on the internet so it is easy to find it (and more crashing code) also in fora and other blogs...


Object[] o = null;
while (true)
o = new Object[]{ o };